Dyno versus Road Power and Torque (HP/NM)
Due to today’s exploding fuel prices and focus on global warming, car manufactures move into smaller and smaller displacement engines to reduce average fuel consumption. They add turbos in order not to lack car performance and gain back power and even better torque. It’s fine, but we don’t save much on fuel if we really use the power a lot. Anyway… Historical cars have been tested on Dyno ‘in fourth gear’ to describe the engine performance in terms of power and torque. The majority focus on the maximum power and have a small attention to the torque curve. For dynamic street use with interval acceleration (overtaking) in the different gears, the torque curve should be the key focus. What does the torque curve look like over the RPM/speed range in the different gears? Dyno test works pretty consistent for natural aspirated (N.A.) and fuel injection engines. Dynos have different dynamic load, but that won’t make a big difference on an N.A. engine. Most tests are made in the 4. gear for a 5. gear car. This is fine for comparison of any improvements. The situation is much different for Turbo charged engines operating to high boost (MAP-Manifold Absolute Pressure). Two things will affect the power and torque curve. At low to mid RPM the load of the engine will affect the power and torque figures Maximum power will be affected of the inlet temperature and therefore dependent on how much air is blown in front of the car during a test Ref 1. With more load on the wheels the engine will burn more fuel. Exhaust flow and heat drop will turn the turbine and the compressor side will produce more air and therefore the engine will produce more power. Different Dyno dynamic load or gear will give different results.
Performance ‘Dyno versus Road’
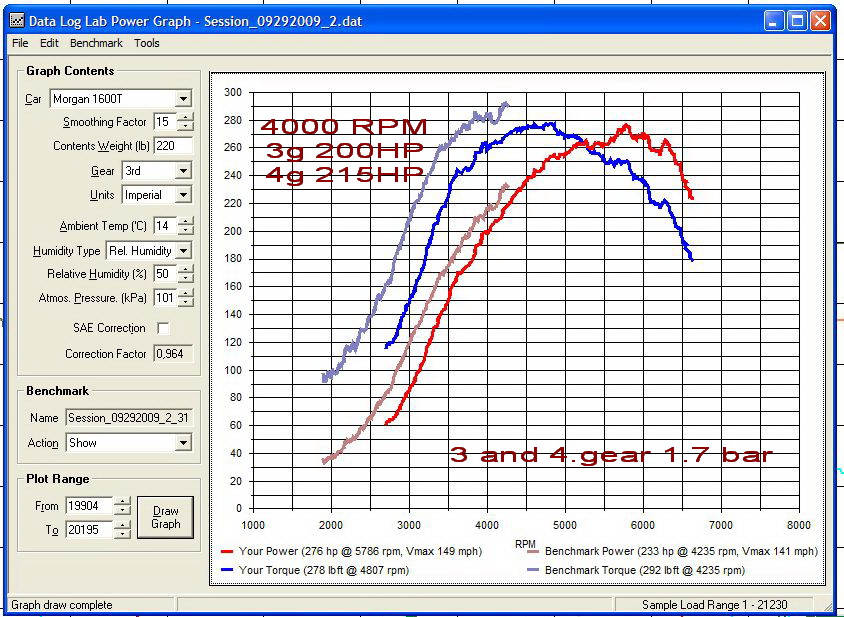
To evaluate the different power curves, I have done some interval speed calculation examples (total car end engine simulations) and compare with real road measurements. Let’s take accelerations from 80-120 km/h (50-75 mph) In 4. gear the RPM range is 2800-4200 and in 5. gear 2296-3445 RPM. Turbo MK1 80-120 km/h Based on Dyno Based on Road Measured on Road 4. gear 3.56 sec. 3.23 sec. 3.12 sec. 5. gear 6.00 sec 4.60 sec. 4.70 sec. The tables show that calculated acceleration from 80-120 km/h in both 4 and 5. gear based on the Dyno curve is far from the actual measured results. The results for the real road acceleration tests are much closer to the simulated results based on the power/torque curves achieved on the road in the corresponding gear. Morgan Turbo video MK1 GT2056 The other example of the earlier power take up at higher load is the shown on the picture. At 4000 RPM in 3. gear power is 200Hp 260 lbft.. (351nm) and in 4. gear 215 HP 282 lbft (380 nm). Made at 1.7 bar 14 deg C.

